Would you call it writer's-block? The statistics seems to suggest like-wise. My blogging discipline has been dismal to say the least. Fifteen posts in 2 years after two 20+ years. Whipsaws aren't restricted to the market I guess.
2008-10 was a tumultuous period, B-School, career switch and subsequent job search in the US in the midst of the greatest recessionary period in the country's history. Add to that life changing events which ensured that I almost stepped into a landmine (not literally) of a relationship which would have blown my life into smithereens.
First things first.
Relationships. They are tricky and have the immense capability to at times sink you, especially if you happen to meet the devil herself. Yes. For me Satan is a SHE and I have met her. And a quick piece of advice for guys out there, SATAN isn't monogamous. My emotions range between regret for my actions and rage and hatred for my ex. Well ex would be giving her a lot of respect. She was an acquaintance who used me to get where she wanted. Her history should have been a HUGE red flag for me but I was at a vulnerable stage of my life in 2007 which fogged my ability to see through her fake, superficial and dark evil soul. Who else would have 3 concurrent relationships all at the same time. Who else wudn't be able to have guys as friends without flirting with them. Who else would lie her way through life, lie to her friends, family, relatives and most of her acquaintances. If you are reading this blog, you know who you are, shame on you. you're life is an abomination and I pity your existence.
Well, enuf with the rant. As they say every black cloud has a silver lining. In my case, its an invaluable and priceless lining. Rita stepped into my life just when I had given up hope of finding love and was ready to move forward in life with the willingness of a compromise. It is often said that your soul mate cannot be searched for but they happen to you when the time is right in your life. Rita and I found each other in such circumstances. More is less when it comes to talking about Rita. For months I have been contemplating a way to write about her without eulogizing her but I guess there isn't a way. All I know is Rita is my soul, the blood that flows in my veins, the air that I breathe and I wish I had found her earlier in life. But seeing her makes me realize that true love does exist. Introspection - Part 2 will detail out our short little love story, one that Im sure you will find very very unique.
Tuesday, June 07, 2011
Friday, April 29, 2011
ETF's for the season
If you are bearish about the dollar as I am, take a look at these two ETF's.
Here is my commentary
Here is my commentary
Brics are going nowhere
Was hilarious to see financial news broadcasters commenting on BRIC's running out of steam earlier this here.
Here is my take.
Here is my take.
Japan in Focus
Dated article on Japan.
Just to remind readers, this article was right after the earthquake in Fukushima
Click here for a read.
Just to remind readers, this article was right after the earthquake in Fukushima
Click here for a read.
Friday, April 08, 2011
Oil Correlations
We are all intrigued with the way the stock market has been increasingly tracking the crude oil price movements.
But there are some startling facts when we take a closer look at the numbers behind the story.
For my analysis, I looked OIL (iPath S&P GSCI Crude Oil TR Index ETN), which tracks the Goldman Sachs Crude Oil Return index which is composed of WTI crude oil futures contracts traded on NYME.
Now if we compare the correlation based on yearly returns on this ETN and the 3 major US based Indices we notice a gradual increase of correlation for the last 4 years, from 2007 to 2010.
Yearly S&P 500 Dow Nasdaq
2010 72.25% 70.09% 67.83%
2009 56.43% 54.32% 51.41%
2008 39.58% 36.58% 34.97%
2007 10.26% 6.90% 6.47%
But what will be startling is the correlation of YTD returns for the same combinations as above and also compare it for the last 5 years for the same time period (first 68 trading days).
YTD S&P 500 Dow Nasdaq
2011 -19.46% -18.61% -23.74%
2010 63.96% 62.81% 54.80%
2009 47.86% 44.92% 43.53%
2008 60.71% 59.49% 58.58%
2007 9.55% 7.35% 4.86%
2011 shows us that the equity markets are negatively correlated to the crude oil prices but instead of a behavioral change in relationship, I would attribute it to the systemic pressures on the market such as the Mid-Eastern political upheavals, Japanese nuclear meltdown and the Capital Hill crisis.
Wednesday, March 16, 2011
Japan Research- Investment Advice in troubled times
The recent Japanese earthquake is of epic proportions and has led to unchartered territory in terms of Japan’s preparedness for a nuclear catastrophe. The Japanese archipelago is located in an area where several continental and oceanic plates meet. This is the cause of frequent earthquakes in the island nation. The worst natural calamity to strike Japan prior to the most recent tragedy was the 17th Jan 1995 Kobe earthquake.
Let us look at the Nikkei-225 prior to the 1995 earthquake. The chart below shows us the price graph from October 1994 till Jan 20 1995 with the highlighted portion detailing the market collapse after the earthquake.

To compare the US markets, we have looked at the S&P 500’s correlation with the Nikkei-225.

This chart shows the 60-day rolling correlation of the S&P 500 from March of 1994 till the 17th of Jan 1995. The trend line in the chart indicates very little correlation between the Nikkei-225 and the S&P 500. But what is interesting to see is the change in the correlation chart post the Kobe earthquake, as shown in the attachment below.

The trend line indicates the clear shift in the trend between the two indexes.
What will be interesting to see is how, the Nikkei-225 fared after the Kobe tragedy.

As is evident from the chart the Nikkei bounced back and followed the S&P 500, which was in the middle of an extended bull run, continuing its upward surge throughout 1995.

Cut to the recent tragedy in Japan, let us take a look at the correlation of the two indices in question, S&P 500 and Nikkei-225 in recent times.

This above chart shows the 60-day rolling correlation of the S&P 500 from April of 2009 till the 15th of March 2011. The trend line in the chart indicates significantly higher correlation between the Nikkei-225 and the S&P 500 than that witnessed in 1995. In fact if we take a closer look at the trading week of the tragedies in 1995 and 2011, we will notice that the average 60-day correlation for the 5 trading days after the 1995 disaster was 7.7% while the last week has seen an average 60-day correlation of 25.5% between the Nikkei and the S&P 500.
Of course part of this could also be attributed to the impact that the North African crisis but there is no denying the significant coupling of the Japanese and US equity markets. If we take a closer look at the volatility in the Nikkei-225 before and after the 1995 tragedy we will notice that the 6-month standard deviation before the 1995 crisis was 0.69% whereas 6 months after the crisis this volatility doubled to 1.4%. This would suggest that with the increased correlation between the two markets and also accounting for the greater damage caused by the recent tragedy, the US markets would share some burden of the volatility going forward.
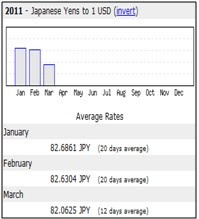
In addition to the equity markets, the currency rates have also been impacted by the tragedy. If we take a closer look at the USD/JPY exchange rates in 1995 we see a short-term strengthening of the dollar due to the yen inflow in the country post the tragedy.

If we look at the YTD exchange rate chart in 2011, we will notice a similar trend reversal which we think will be similar to what was witnessed in 1995.
From an investment opportunity stand-point, I feel this should be a good time to re-evaluate new positions in VXX and FXY for the short-term.
Let us look at the Nikkei-225 prior to the 1995 earthquake. The chart below shows us the price graph from October 1994 till Jan 20 1995 with the highlighted portion detailing the market collapse after the earthquake.

To compare the US markets, we have looked at the S&P 500’s correlation with the Nikkei-225.
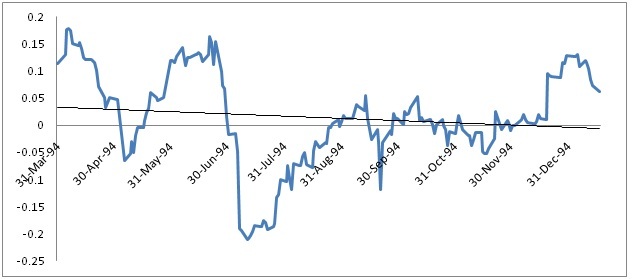
This chart shows the 60-day rolling correlation of the S&P 500 from March of 1994 till the 17th of Jan 1995. The trend line in the chart indicates very little correlation between the Nikkei-225 and the S&P 500. But what is interesting to see is the change in the correlation chart post the Kobe earthquake, as shown in the attachment below.

The trend line indicates the clear shift in the trend between the two indexes.
What will be interesting to see is how, the Nikkei-225 fared after the Kobe tragedy.

As is evident from the chart the Nikkei bounced back and followed the S&P 500, which was in the middle of an extended bull run, continuing its upward surge throughout 1995.

Cut to the recent tragedy in Japan, let us take a look at the correlation of the two indices in question, S&P 500 and Nikkei-225 in recent times.

This above chart shows the 60-day rolling correlation of the S&P 500 from April of 2009 till the 15th of March 2011. The trend line in the chart indicates significantly higher correlation between the Nikkei-225 and the S&P 500 than that witnessed in 1995. In fact if we take a closer look at the trading week of the tragedies in 1995 and 2011, we will notice that the average 60-day correlation for the 5 trading days after the 1995 disaster was 7.7% while the last week has seen an average 60-day correlation of 25.5% between the Nikkei and the S&P 500.
Of course part of this could also be attributed to the impact that the North African crisis but there is no denying the significant coupling of the Japanese and US equity markets. If we take a closer look at the volatility in the Nikkei-225 before and after the 1995 tragedy we will notice that the 6-month standard deviation before the 1995 crisis was 0.69% whereas 6 months after the crisis this volatility doubled to 1.4%. This would suggest that with the increased correlation between the two markets and also accounting for the greater damage caused by the recent tragedy, the US markets would share some burden of the volatility going forward.
In addition to the equity markets, the currency rates have also been impacted by the tragedy. If we take a closer look at the USD/JPY exchange rates in 1995 we see a short-term strengthening of the dollar due to the yen inflow in the country post the tragedy.

If we look at the YTD exchange rate chart in 2011, we will notice a similar trend reversal which we think will be similar to what was witnessed in 1995.

From an investment opportunity stand-point, I feel this should be a good time to re-evaluate new positions in VXX and FXY for the short-term.
Saturday, March 05, 2011
Subscribe to:
Posts (Atom)